Venn Diagram
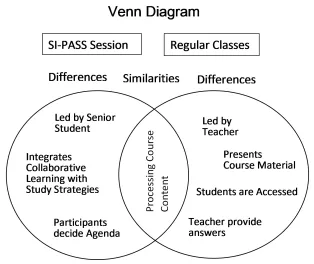
A Venn Diagram can be used to compare the similarities and differences between two concepts, systems or theories.
How?
- Two overlapping circles are drawn on the board with each circle labeled as one of the two concepts.
- Students will then write the similarities in the overlapping portion and the differences in the outer portion of the circles. This is a good visual technique for reviewing similar yet contrasting concepts.